

No Free Lunch, Part 2
-
 John Mauldin
- |
- March 22, 2019
- |
- Comments
- |
- View PDF
 John Mauldin
No Free Lunch: Return Is Determined by Valuation (Part II)
Fairly Valued vs. Overvalued
Implications for Your Portfolio Today
What to Do About It
Summary
Diversifying Your Trading Strategies
Cleveland, New York, Austin, and Dallas
Matching the stock market’s long-term average returns sounds like it should be easy, if you’re patient enough. But in fact it is remarkably difficult. In last week’s letter, Ed Easterling and I showed you why it is a longshot bet in almost every market environment. Returns over a decade or two are usually well above or well below average. Most of all, it’s fairly predictable which side of average will occur.
This has serious implications for retirees, near-retirees and accumulators. Fortunately, there’s a lot that you can do to still achieve investment success. Today Ed and I will expand on that discussion. If you missed last week’s letter, you might want to read it here first.
Ed founded Crestmont Research in 2001 to research secular stock market cycles and graphically explain everything about them. You can find a treasure trove of his fabulous charts and articles on cycles and market returns at www.CrestmontResearch.com. Longtime readers know that I’m a big fan of Ed’s work and highly recommend both of his books, especially Unexpected Returns.
We left off last week writing about the power of the price/earnings ratio (P/E) on the way to describing how it not only predicts, but also drives returns. Let’s jump back in; we have a lot to cover.
No Free Lunch: Return Is Determined by Valuation (Part II)
By John Mauldin and Ed Easterling
The price/earnings ratio (P/E) has a multiplier effect on stock returns. Over 10–20 years, P/E can dramatically increase or decrease, resulting in a significant addition or reduction in total return. This can either help or hurt investors. In the secular bear market of the 1960s and ’70s, the decline in P/E virtually eliminated the return from earnings growth and dividend yield. In the 1980s and ‘90s, the increase in P/E more than doubled the return for many of the decade-long periods during that secular bull market.
P/E’s effect reaches beyond earnings and capital gains. It exerts significant control over dividend yield. And, as it turns out, the reinforcing result ends up being in the favor of P/E’s other effects.
The chart below shows a high correlation between P/E ratio and dividend yield. P/E is plotted on the left axis and dividend yield runs across the bottom axis. Each dot on the graph represents the combination of P/E and dividend yield for each year since 1900. The resulting pattern provides insights about the relationship across a full range of conditions. High P/E is closely associated with low dividend yields and low P/E coincides with high dividend yields.
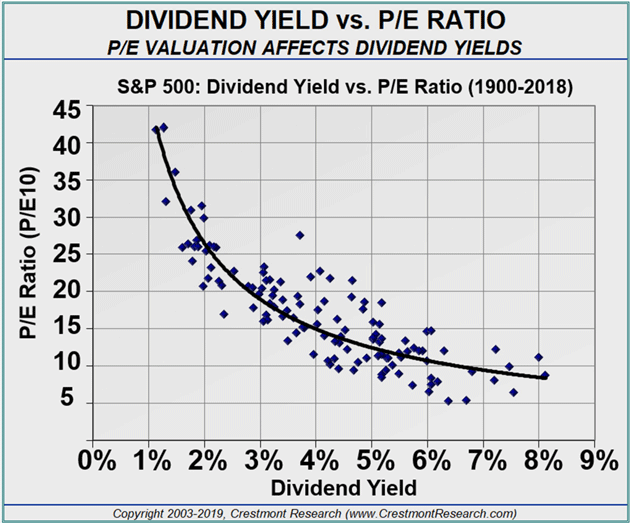
This is one of those rare instances when correlation reflects causation. P/E is the relationship of price to earnings. Dividend yield is the relationship of dividend payments to price (D/P). Therefore, with price as the variable that both ratios have in common, we can mathematically eliminate it for comparison and recognize that P/E and dividend yield actually reflect the relationship of earnings to dividends.
Since dividends are paid from earnings, and since the share of earnings paid as dividends varies in a relatively narrow range over time, we see a close relationship between the two ratios. Valuation drives dividend yield. For example, the same dividend amount when price is based upon P/E at 20 has twice the yield when price is driven by P/E at 10.
Therefore, when a decade starts with P/E relatively low, not only is there an increased likelihood rising P/E will boost returns, but the same low starting P/E also boosts returns by driving dividend yield higher. The opposite effects occur during periods that start with relatively high P/E.
These principles of valuation, rather than random chance, are what drive stock market returns. That’s good because a principle-driven market is much more reliable and understandable than a random one.
This is in keeping with Benjamin Graham’s axiom, “In the short run the market is a voting machine. In the long run it’s a weighing machine.” And what it weighs are earnings.
As with many things in life, there is no certainty. But don’t allow perfection to be the enemy of the good. Low valuation significantly raises the odds of above-average results over the following 5–10 years. High valuation significantly raises the odds that cat food may be on your menu, unless you act to manage risk and enhance returns.
Neither instance is a certainty, but knowing the propensity helps you manage risk and invest for return.
Fairly Valued vs. Overvalued
It’s hard to know what to believe about today’s market. Some reports indicate that the market is overvalued, while others write about a fairly valued market with lots of upside. Those in the overvalued camp point to P/E currently being over 30. Market bulls present values near 20 or 16.
Like what you’re reading?
Get this free newsletter in your inbox every Saturday! Read our privacy policy here.
Looking only at actual reported earnings (without subjective adjustments and future forecasts), most reports of P/E stand near 20 and up to 30 in a few instances. The long-term historical average is around 15. P/E has declined below 10 during periods of high inflation or significant deflation and generally rises toward the mid-20s when inflation is low and stable. Therefore, P/E is currently above average, but is it fairly valued near 20 or overvalued near 30?
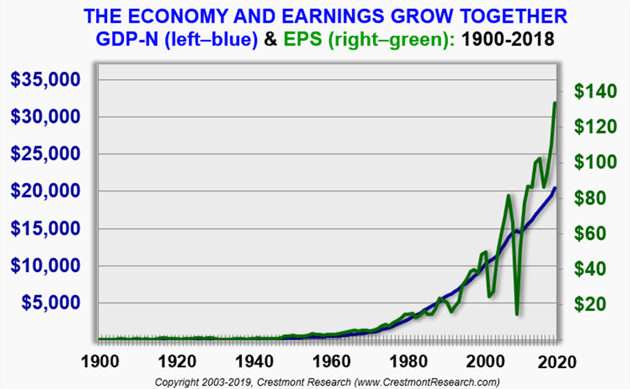
The next chart shows a long history of economic growth (measured with nominal gross domestic product) and earnings growth (measured with earnings per share for S&P 500 companies). We see the effects of business cycle fluctuations in EPS around a steadier economic progression in GDP. This graph visually reinforces why some analysts prefer to normalize earnings in order to moderate distortions. Averaging earnings over a period of time, typically 10 years, removes the recessions and business cycle outliers.
Some analysts and investors believe corporate earnings have recently upshifted and are unlikely to revert. They cite tax changes, trends in service industries, technology, and other causes. Yet all those factors and more have affected earnings, margins, and the economy for more than a century and none have conquered business cycle-driven reversion. Nonetheless, if we were earlier in the cycle, P/E would be near 20 and the market would be fairly valued.
Others think profit margins will again revert as they consistently did in the past. While profit margins and earnings may be surging, competitive processes will ultimately drive returns on equity back in line with debt yields plus equity risk premiums. The current elevated profits offer handsome returns and attract new competitors or predatory responses from existing competitors. Regardless, using various methods to normalize the business cycle shows us that P/E is near 30 and the market is vulnerable to correction.
Many on Wall Street continue to promote optimistic valuations. Buy-and-hold strategies sell better when the market is supposedly not expensive and when the market’s driver is randomness.
On the other hand, analysts and followers of CAPE P/E10, Crestmont’s P/E, and other normalizers disagree that this time is different. History rarely repeats but it does provide a powerful laboratory of experiences to assess plausibility. For now, the adage regarding history repeating has the upper hand over the adage that this time is different.
(The CAPE or “cyclically adjusted price to earnings” ratio is a valuation measure that uses real earnings per share (EPS) over a 10-year period to smooth out fluctuations in corporate profits that occur over the business cycle. It was popularized by Yale University professor Robert Shiller so it is also known as the Shiller P/E ratio. While John and Ed both believe the Crestmont ratio is superior, the CAPE is better known.)
Implications for Your Portfolio Today
To assess the stock market’s likely outcome over the next 10 years, our next graph combines P/E and 10-year annualized returns. The green bars represent the annualized total return from each decade-long period since 1900. The first bar is the period from 1900-1909 and the last bar is 2009-2018.
For each decade, P/E at the start of the respective period is graphed on an orange line. To show the predictive power of valuation on decade-long returns, the two series are offset by 10 years.
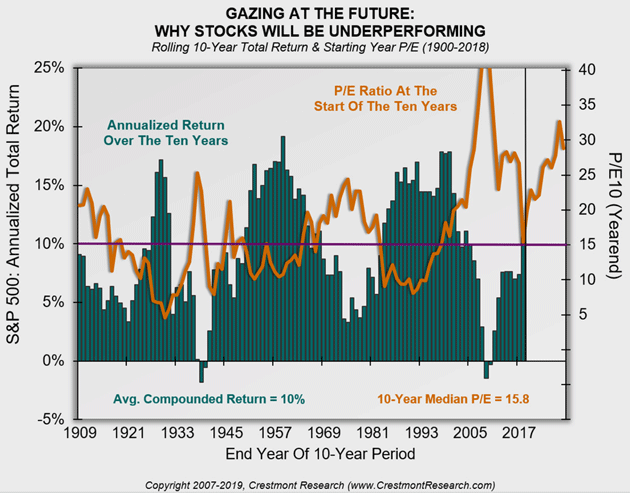
For example, note the trough in the 1970s, just over halfway across the series of green bars. The lowest point is the 10-year period from 1966-1975. The annualized compounded total return (i.e., capital gains plus dividends on a nominal basis) over that decade was 3.3%. The corresponding point directly above that bar is normalized P/E at the beginning of 1966, when CAPE P/E10 was slightly over 24.
The white space on the graph’s right side represents nine decades still underway. The last green bar is the period starting with 2009 and ending in 2018. The nine decades now in process have starting dates from 2010 through 2018.
Most important, each decade-in-process has already established its starting P/E level. Investments that start or continue in those years will perform based on the market’s valuation at that time. A diversified stock portfolio that starts at a low price inevitably outperforms one starting at a higher price.
As the bars fill in under the P/E line in the coming years, we can expect their height to generally decline to reflect the market’s rising valuation of the market across the nine years. This does more than demonstrate the inverse relationship between valuation and performance; it provides a forward-looking view of what to expect in the future.
Decades that start with high valuation can be expected to deliver 10-year annualized returns near historic lows. This doesn’t mean every year will be muted. To the contrary, investors should expect typical volatility and annual variability. But at such high valuations, bulls have less charge and bears more so.
This effect can be represented as skew in the potential outcomes for stock market returns and is highly relevant today. Valuation doesn’t drive short-term fluctuations, but it does affect the aggregate range of outcomes.
What to Do About It
Warren Buffett’s first rule of investing is “Never lose money.” His second rule is to never forget the first rule! His many decades of investment experience demonstrate the importance of minimizing losses. Losses have a disproportionate effect on cumulative returns compared to gains.
Like what you’re reading?
Get this free newsletter in your inbox every Saturday! Read our privacy policy here.
The next chart shows how a small loss requires a slightly larger gain to return to breakeven. Getting back where you started requires progressively higher gains as the magnitude of the loss increases.
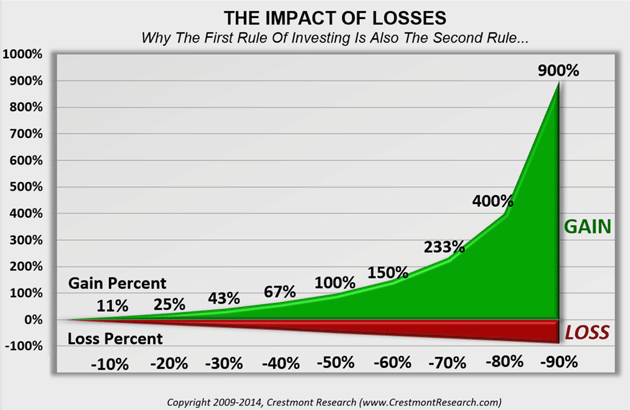
The relationship works in both directions. A 40% loss can wipe out a 67% gain. Likewise, a 40% loss requires a 67% gain to recover. This disproportionate effect occurs because the loss occurs on the higher value.
There are many ways to manage portfolio risk and control losses. The tools include direct hedges (e.g., options), portfolio structure (e.g., diversification), and active management (e.g., dollar cost averaging, rebalancing, value investing). Some investment funds and financial advisors provide these for investors who don’t have the time or interest in actively managing their portfolios.
Within portfolio structure, investors can achieve diversification in a number of ways. It is more than simply multiple holdings. True diversification should include securities that are not correlated with each other so the portfolio’s engines work independently.
Diversification can also include holdings that are fundamentally or historically counter-correlated. These holdings are expected to zag when other holdings zig. The goal is not to find direct offsets, but rather to expect that each component will deliver more upside than downside.
Furthermore, when evaluating investments for diversification, consider the current return outlook. We’ve seen how average can be uncommon, even over long periods. Often, the likely result is well above or well below average.
For example, the benchmark return should be the likely future return, based upon current conditions. When the outlook for stock returns is low, many moderate “safer” investments can be attractive as diversifiers without significantly reducing overall portfolio return.
Summary
The Great Bull Market of the 1980s and 1990s delivered high returns but also reinforced some myths and misunderstandings. The academic theories of that period were inconsistent with the investment approaches investors used. They diverged from the historical wisdom of past investment sages like Benjamin Graham and David Dodd.
Graham and Dodd recognized that markets and related financial series fluctuate. Changes in valuation affect investment decisions and outcomes. Markowitz recognized this as well. He started his presentation of Modern Portfolio Theory by separating the need for relevant assumptions from his model for portfolio construction. Nonetheless, conventional wisdom soon oversimplified the crucial assumption-setting step.
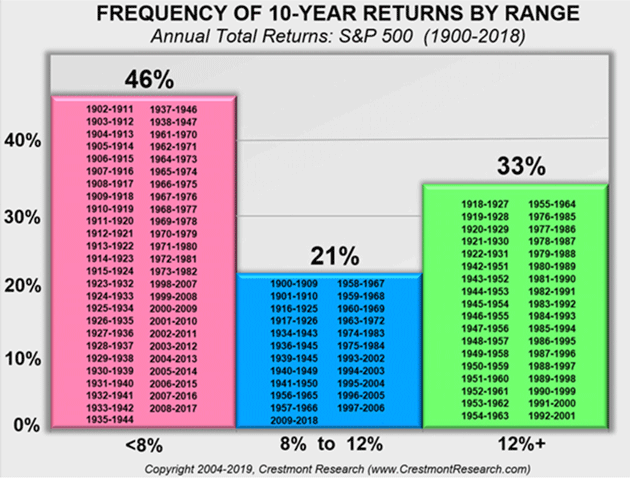
The stock market’s long-term average return is a centerline around which the returns from almost all periods fluctuate. The profile of returns over periods of a decade or two looks like a barbell, with the likely outcomes concentrated away from the center. The profile is not a bell-shaped curve with most instances near the middle. Empirically, above- and below-average outcomes are much more common than average, as seen in this chart we shared last week.
“Average” is a convenient guess when outcomes are random. Statistically, average gets closest to the actual result when there is no order or pattern in the data. This may be why followers of stock market randomness use the century-long assumption for average stock market returns. If they pick the middle, they’re likely to have a small variance to explain. But if they predict in one direction and it ends up in another, they look like a weatherman.
Yet when outcomes are driven by principles—which makes them relatively predictable over investors’ horizons—assuming the average becomes the best way to be wrong.
Valuation drives stock market returns because of financial principles. Market valuation rises and falls in response to changes in inflation. When inflation rises, values fall to provide additional return as compensation.
Most financial assets, especially stocks, rise toward their highest relative value (and lowest expected return) when the inflation rate is low and stable. Bond prices rise as yields fall in response to declining inflation. Stocks, as perpetual securities, react especially well to low inflation. Coupons and dividends are most valuable when the inflation villain is subdued.
For now, inflation and bond yields are relatively tame. The stock market is currently somewhere between relatively high and overvalued by most measures. Either way, we think investors should assume below-average returns over the next decade or two. Even if today’s relatively high valuation is near fair value due to low inflation, fair value doesn’t produce average returns. Fair value delivers a return commensurate with starting valuation.
The outlook of low returns is not destiny; it is only a statement of current market conditions. Recognizing it helps investors manage investment portfolios to mitigate risk and enhance returns. There are many options for your investment portfolio other than investing in highly valued stocks. Ask your investment advisor about such options.
Like what you’re reading?
Get this free newsletter in your inbox every Saturday! Read our privacy policy here.
In a low-return environment, incremental enhancements that control risk and boost returns have more significant impact than in high-return environments. A small enhancement during the ‘90s might have been overlooked, while the same over the past 20 years would have had a material effect for accumulators and retirees.
Diversifying Your Trading Strategies
John Mauldin here. Long time readers know I’m a fan of diversifying your trading strategies as opposed to merely diversifying asset classes. That’s especially important when each asset class already has relatively high valuations. Starting from these high valuations, it is possible you are just diversifying your future losses.
While there are many ways to accomplish this, I have developed one alternative with which I am very pleased, given recent market volatility. You can find more information in the special report I’ve titled “Investing During the Great Reset.” Click on the link to learn more.
I think the next few years and perhaps even the next decade will be particularly challenging for the typical buy-and-hold, 60/40 portfolios. You don’t want to trust your retirement to a static model, especially going forward from today’s high valuations. I really urge you to get and read this paper.
I co-manage the portfolio with Steve Blumenthal of CMG, with whom I am also affiliated and registered.
Cleveland, New York, Austin, and Dallas
I have finally had both eye surgeries. So far, I’m very pleased with the results. The world is much brighter and clearer without looking through cloudy, colored cataracts. I have to return to Cleveland for a final checkup in early April, plus a quick one-day trip to New York to see yet another doctor about a 25-year-old hand injury which is starting to act up quite painfully. It happened in one of several skiing accidents which eventually convinced me to stay off the slopes.
Also next month I’ll make a quick trip to Austin and Dallas where I will do investor presentations for CMG. Please join us if you are in one of those cities. Click here for more information and to register. Then I return home to Puerto Rico for hopefully three straight weeks.
Shane has been on the road with me these last 10 days and what will be six plane trips. She has really made a difference in my being able to handle it all while staying productive. How did I get along without her all those years?
And with that, it’s time to hit the send button. Have a great week! Spring is finally here. The Strategic Investment Conference is sold out, so if you procrastinated but still want to attend you might want to get on the waiting list. There are always a few cancellations.
Your ready for warm weather analyst,

John Mauldin
P.S. If you like my letters, you'll love reading Over My Shoulder with serious economic analysis from my global network, at a surprisingly affordable price. Click here to learn more.
Tags
Suggested Reading...
|
|


Did someone forward this article to you?
Click here to get Thoughts from the Frontline in your inbox every Saturday.
