5 Signs the Stock Market Can Crash Any Time Soon
- Tony Sagami
- |
- March 31, 2016
- |
- Comments
BY TONY SAGAMI
In the “good old” days, investment professionals would focus on boring numbers like days sales outstanding, operating margins, cost of goods sold, accounts payable, and paid in capital.
Today, however, what passes for analysis is the dissection of every syllable that comes out of Janet Yellen and Mario Draghi’s mouths. I never thought I’d see the day on Wall Street when linguistics was more important than things like revenues and profits.
I still, however, believe in the basics of old-fashioned fundamentals like balance sheet and financial statement analysis. If you’ve been around long enough, you know that fundamentals do matter and that the current rally based on monetary steroids is doomed to fail.
In fact, the warning signs are really starting to pile up.
Warning Sign #1: The Bull Market Turns 7
This bull market is more than seven years old, and only one rally in history has lasted longer—from December 1987 to March 2000. After that, we had a two-and-a-half-year bear market that chopped the stock market in half.
Warning Sign #2: The Adjusted P/E Ratio Is at 24
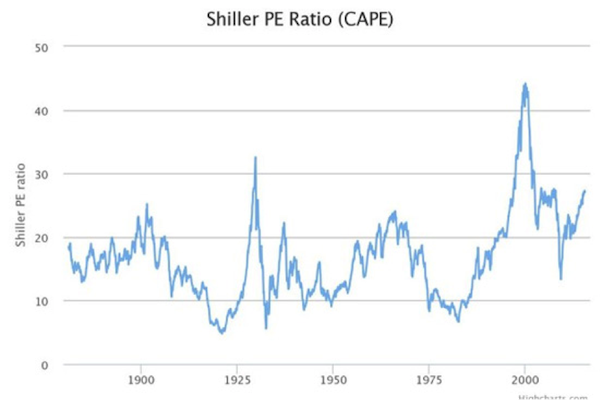
One of John Mauldin’s pals is Nobel laureate Robert Shiller, and his cyclically adjusted P/E or CAPE ratio is screaming “Danger” at 24 times earnings compared to the historical average of 16.
Warning Sign #3: The PEG Ratio Is at an All-Time High
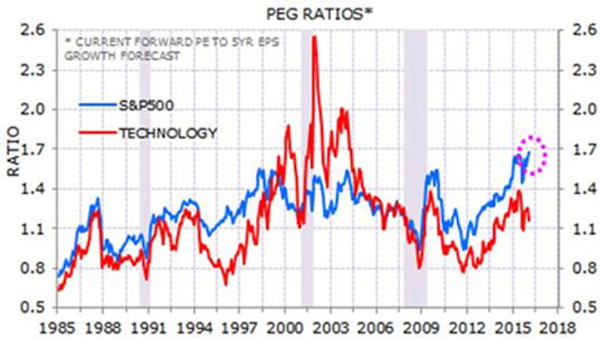
Even more telling to me is that the US stock market is the most expensive it has ever been as measured by the PEG (price-earnings-to-growth) ratio. The S&P 500’s current PEG ratio is 1.7, an all-time high.
Warning Sign #4: Falling Bond Prices
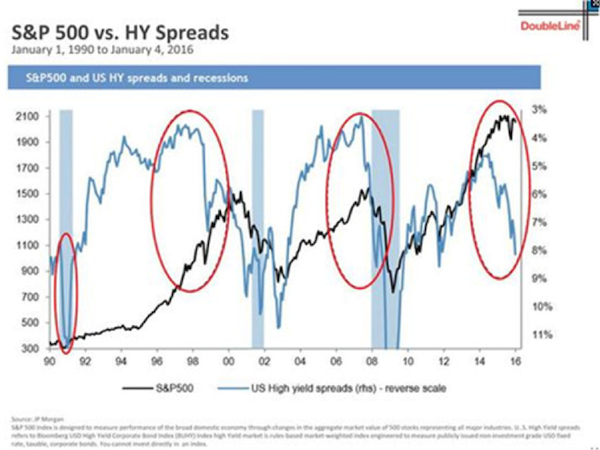
Falling junk bond prices have been a very good canary in the stock market coal mine.
• Junk bond prices tumbled well in advance of the dot-com implosion.
• Junk bonds peaked shortly before the Financial Crisis slaughtered investors.
Junk bond prices started falling around 18 months ago, and the S&P 500 shouldn’t be far behind.
Warning Sign #5: Overvalued Housing Market
The stock market isn’t the only market that appears overvalued. I’m talking about real estate. My reasoning is simple: home prices are up, but incomes aren’t.
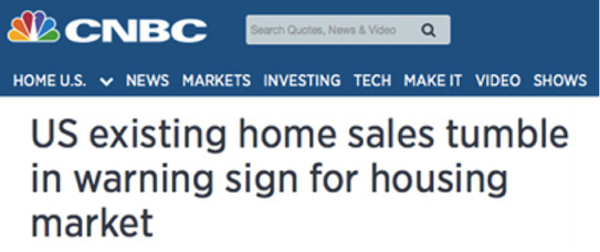
• In 2007, the median household income in the United States was $57,936, but in 2014, it dropped to $53,657.
• In 2007, the average home in the US cost $247,900, but prices increased to $278,800 in January 2016.
Those two polar opposite forces just cannot go on forever. Either Americans have to start earning more money or real estate prices have to fall. My bet is for lower prices.
So What’s an Old-Fashioned Investor Supposed to Do?
So what should you do? I think there are just three basic strategies that will protect your portfolio:
Survive & Thrive Strategy #1: load up on generous dividend-paying stocks. In this topsy-turvy world of ZIRP (zero interest rate policy) and NIRP (negative interest rate policy), stocks that pay out generous, sustainable dividends will be one of the few places that will hold their value.
Here’s proof: Through the beginning of March, two dividend-focused ETFs—iShares Select Dividend ETF (DVY) and SPDR S&P Dividend ETF (SDY)—outperformed the S&P 500 both going down and going up.
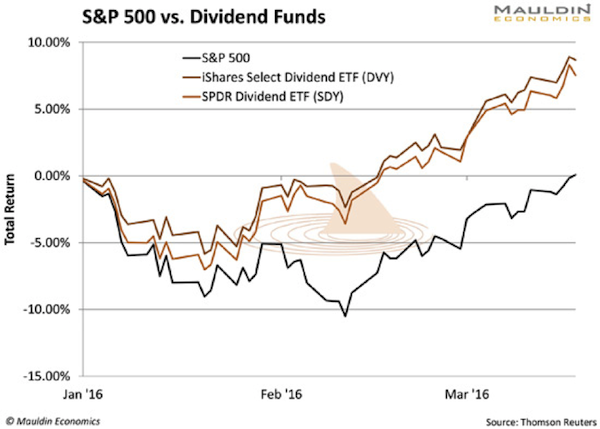
These two dividend ETFs lost significantly less money than the S&P 500 from December 31, 2015 through February 11, 2016. Not only that, they maintained that outperformance even as the stock market recovered.
Survive & Thrive Strategy #2: Raise cash... lots of it. Of course, cash pays almost nothing thanks to our hallucinating central bankers, but zero will be your hero when things turn ugly.
Survive & Thrive Strategy #3: If you have some capital you can afford to speculate with, you should consider taking out some portfolio insurance with inverse ETFs and/or put options.
In reality, you probably need all three of the above strategies, but more importantly, you need to remember that old-fashioned investment values never go out of style.
In the current edition of Yield Shark, I’m talking at length about what dividend stocks can do for you—and recommend a winner whose revenues were up 44% year over year in the last quarter.
Subscribe to Tony’s Free Weekly Newsletter
Markets rise or fall each day, but when reporting the reasons, the financial media rarely provides investors with a complete picture. Tony Sagami shows you the real story behind the week’s market news in his free weekly newsletter Connecting the Dots.
