2 Charts That Show Smart Money And Dumb Money Are Moving In Opposite Directions—Here’s Why
- Stephen McBride
- |
- October 9, 2017
- |
- Comments
This article appears courtesy of RiskHedge.
While all seems calm in the markets, with stocks continuing to hit all-time highs, an interesting trend has emerged underneath the surface.
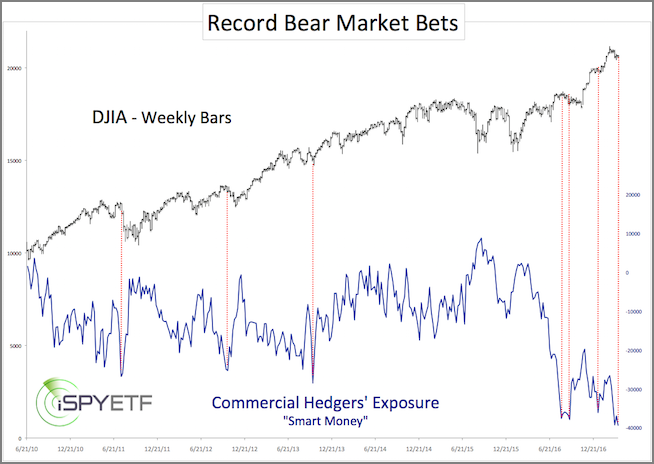
Combing through the latest Commitments of Traders report from the CFTC, we found that commercial traders (“smart money”) have a record number of short positions in the Dow Jones (DJIA).
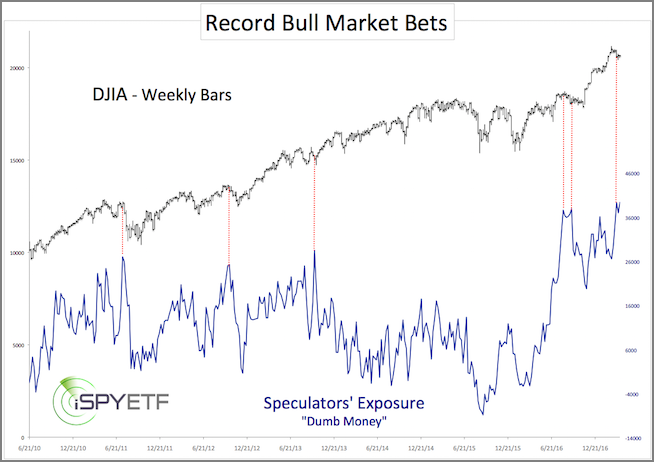
At the same time, noncommercial traders (“dumb money”) have a record number of long positions.
You may be thinking “one group thinks stocks will go up, and the other thinks stocks will go down. What’s the big deal?”
Here’s the big deal.
Buy Low, Sell High—A Pro’s Game
There’s a strong negative correlation between commercial trader’s short positions and the Dow Jones Industrial Average (DJIA), as the below chart shows. When short positions increase, the DJIA usually falls… perfect timing!
Interesting, the opposite is also true. When noncommercial traders increase their long positions, the market usually drops shortly thereafter. It seems they have a habit of buying the market at exactly the wrong time.
Given that the “smart money” usually wins this tug of war, let’s focus on the reasons behind their negative outlook for stocks.
Here’s some of the reasons professional money managers may be growing cautious about stocks today.
Value Investors Say No, Here’s Why
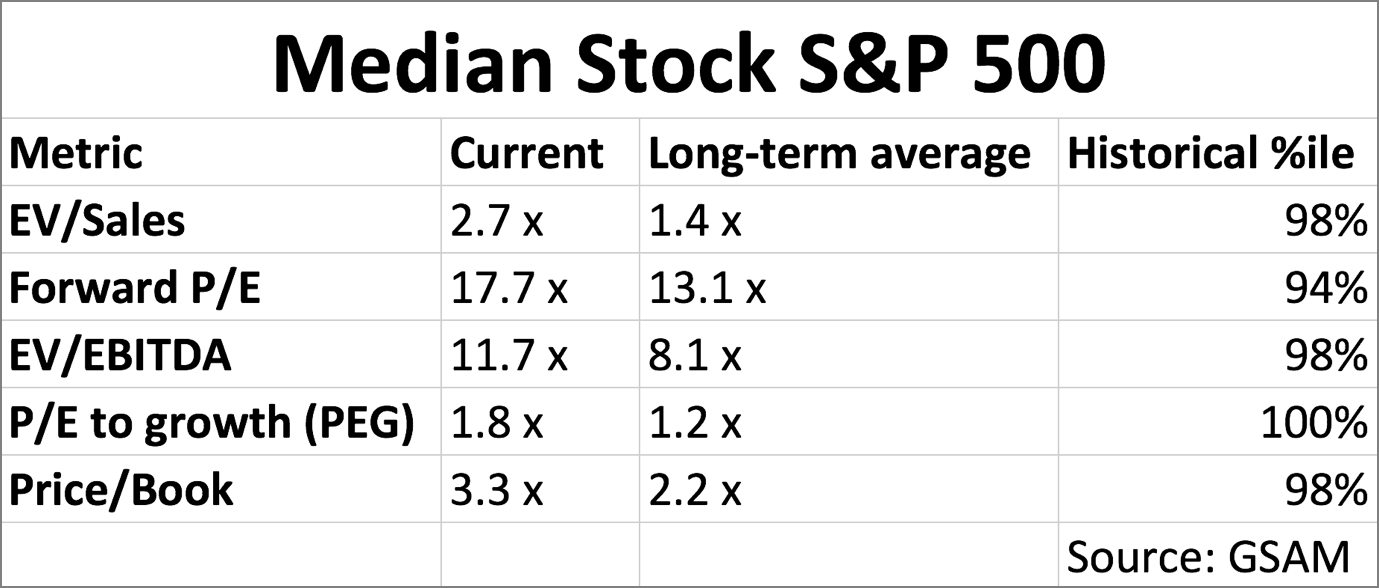
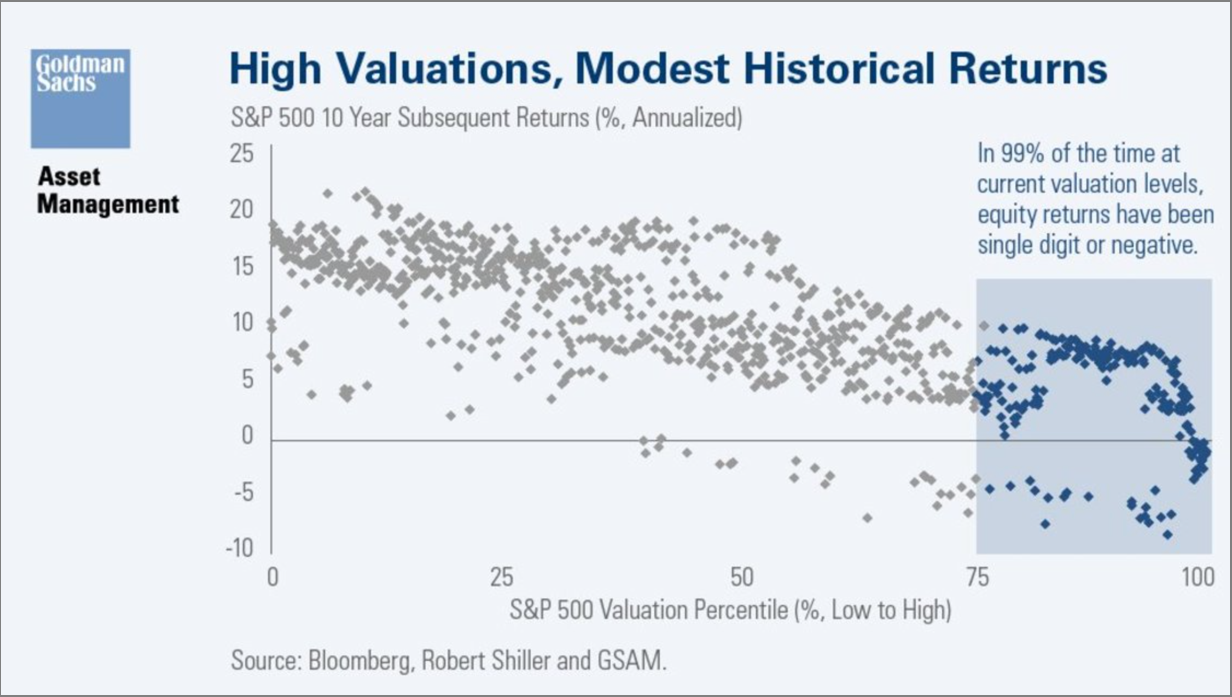
Findings from Goldman Sachs Asset Management (GSAM) show that by just about every measure, stocks are expensive today.
Source: Mauldin Economics
But it’s not only US stocks, which are trading at all-time highs.
This chart from Deutsche Bank shows that, in their own words “we’re in a period of very elevated global asset prices—possibly the most elevated in history.”
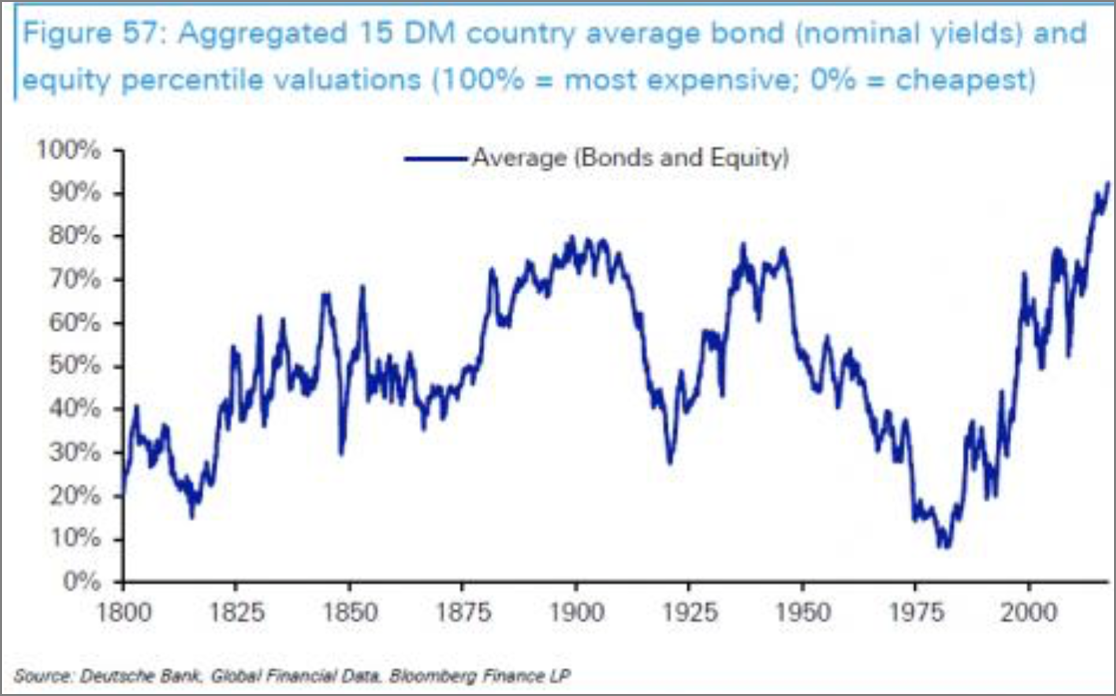
Lofty valuations are likely a big factor in Warren Buffett and Seth Klarman’s reasoning for holding record levels of cash in their portfolios.
In September Warren Buffett’s Berkshire Hathaway had $99.7 billion in cash on the sidelines.
Seth Klarman’s Baupost Group also held 42% of their portfolio in cash, their largest single position.
So, US stocks are expensive by most measures. But they have been expensive for quite some time.
High valuations don’t mean a crash is imminent. They do, however, tell us something about future returns.
If You Buy High, Expect Low Returns
This chart from GSAM shows that in 99% of the time since 1926, current valuation levels have led to poor returns over the following decade.
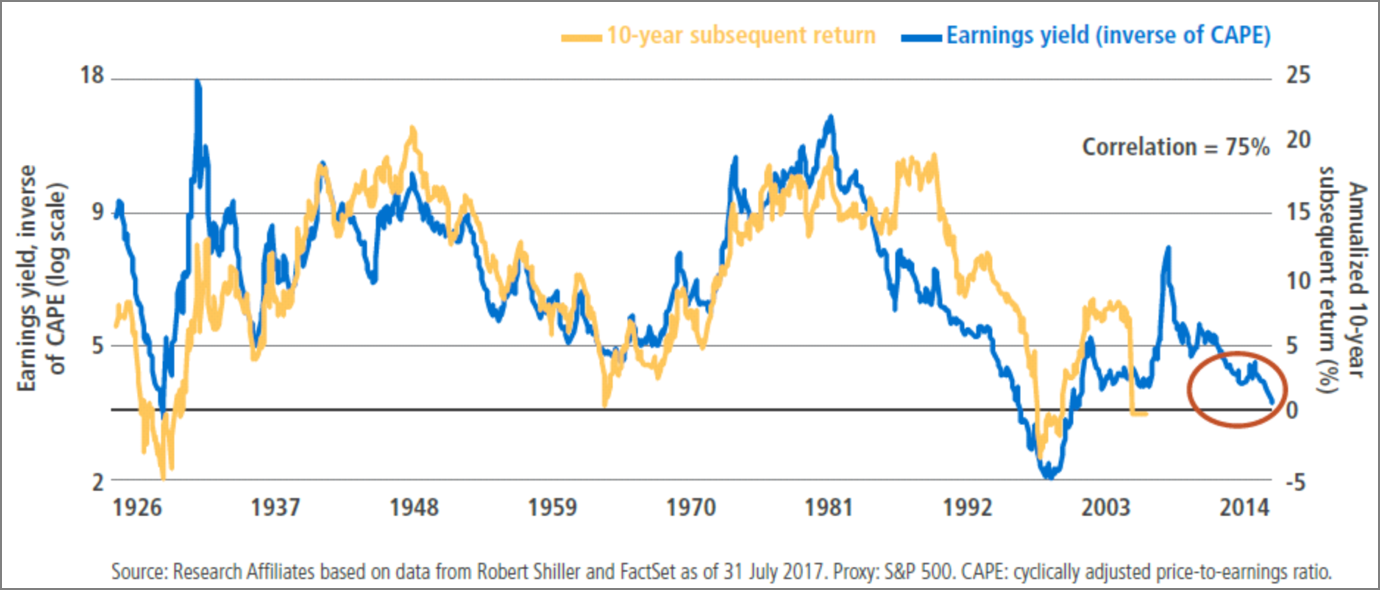
Data from Research Affiliates, a leading investment analysis firm, expresses this point in a different way.
They found that since 1925, 10-year returns on US stocks have been strongly correlated to the earnings yield on those stocks. As such, they estimate returns in the coming decade will be a measly 3%–4%.
With such low returns expected, it’s no wonder that both PIMCO and T. Rowe Price recently urged their clients to cut their allocation to US stocks.
Bringing it back to the valuations again, they tell us something else about the future of the market.
The Next Correction Will Be Severe
The other big takeaway from today’s valuations is that when the correction does come, it will be severe. Findings from Star Capital show that downside risk tends to increase as market valuations become excessive.
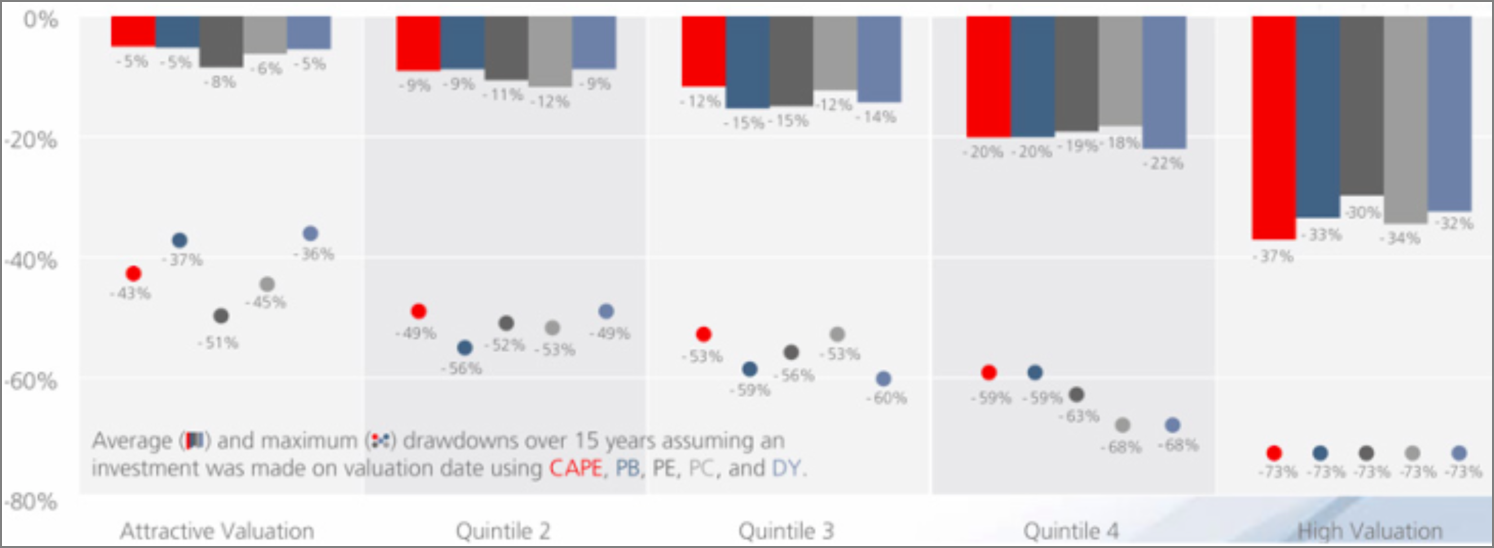
With current market valuations firmly in the “expensive” column, investors would be wise to proceed with caution.
While the focus here has been on the reasons why professional investors are growing cautious on US equities, there is also concern about bubbles forming in a number of other asset classes.
How to Invest in the Age of The Everything Bubble
Whether it’s corporate credit, indexing, cryptocurrencies, or auto loans, money is pouring into several assets at record rates, thus pushing up valuations… and risk.
This, coupled with record levels in the stock market, means we are living in the age of the everything bubble.
And here’s the important question: How do we invest in the age of the everything bubble? My colleague Jared Dillian recently put together a special report that contains the answers.
Grab Jared Dillian’s Special Report, Investing in the Age of the Everything Bubble for free, here.
As a Wall Street veteran and former Lehman Brothers head of ETF trading, Jared Dillian has traded through two bear markets.
Now, he’s staking his reputation on a call that a downturn is coming. And soon.
In this special report, you will learn how to properly position your portfolio for the coming bloodbath. Claim your FREE copy now.

This article appears courtesy of RH Research LLC. RiskHedge publishes investment research and is independent of Mauldin Economics. Mauldin Economics may earn an affiliate commission from purchases you make at RiskHedge.com

