
Monetary Dilemma
-
 John Mauldin
- |
- March 29, 2024
- |
- Comments
- |
- View PDF
 John Mauldin
Leaders take a lot of criticism. In fact, that’s part of the job. Presidents, governors, CEOs, football coaches, other top decision makers and even your humble analyst all have to answer for what happens on their watch—even when it’s not their fault. Then-general Dwight Eisenhower prepared a letter for release in case the 1944 Normandy landing failed, placing all blame on himself. Which, I suspect, he knew would happen anyway.
This applies to Federal Reserve leaders, too. I’ve given them a lot of grief (deservedly so but less these last two years) but I also don’t envy them. They have to make high-stakes decisions with unreliable data, within constraints set by politicians and long-ago predecessors. The “right” choice is rarely available to them. It’s kind of remarkable anyone is willing to do the job.
Now the Fed is at an important turning point. Having tightened to control inflation, they have to decide what’s next. The first question is whether inflation is truly under control. If it is, then the next question is whether the policy that controlled it is having other undesirable effects. And if that’s the case, what can/should the Fed do about it?
These tough questions will be today’s topic. They will also, let me add, be high on the agenda of our virtual Strategic Investment Conference which is now less than a month away. I can confidently say this year's SIC will be the best ever.
I will soon be doing a full presentation of our speaker list as we get closer to finalizing it, but let's look at a few highlights. We will cover the full spectrum on cycles and government debt with Neil Howe, George Friedman, Peter Turchin, and your humble analyst. This topic is extremely important as it sets the background for everything on the economic, political, and social agendas. (I am finishing up a book on the topic!)
Felix Zulauf is simply one of the best macro investors of our time. Leon Cooperman and Ron Baron will help us understand our current situation. Both made billions for their clients and themselves. Let some of their wisdom help you.
Dan Tapiero, who runs over a billion dollars invested in crypto infrastructure, whose fund is one of the most successful in that space of anyone, will join Lyn Alden to give us a deep dive on what’s happening behind the scenes in the crypto and blockchain space.
Mark Mills is, in my opinion, the best energy analyst anywhere (and I have done some homework in the energy space). Howard Marks (Oaktree Capital) will be giving us insights on markets and credit. Uber-successful Joe Lonsdale, co-founder of Palantir and numerous tech companies, will host his hand-picked panel on AI. Frank Luntz will set up the presidential election along with other analysts.
There will be over 50 faculty, in individual presentations and panels. Some familiar faces you know and some controversial. You can see the current lineup by clicking here. Then sign up. The conference is for five days spread out from April 22-May 1. You can hear it live or watch it when you want, read the transcripts, or listen to the audio. And review at your leisure. I give you the best possible conference in a very convenient format. All run by a team of experienced pros. Sign up now. Procrastination kills.
Now, let’s look at inflation.
Perception vs. Benchmark
“Price stability” is impossible to define unless you specify which prices you mean. This varies widely. Every inflation benchmark is necessarily generalized and would be even if we had ways to accurately track all goods and service prices in real time, which we don’t.
A further complication is the same goods and services can have widely different prices in different locations. Inflation is both individualized and localized. Nor is it as simple as measuring the quantity of money, since that, too, is a moving target in a fractional reserve banking system. And the quantity of money is not a reliable short- or mid-term predictor of inflation except at the tails of the curve.
On top of all this, we must add the very real limits of human perception. Most people don’t keep careful records of how much they pay for everything they buy. They have, at most, a kind of general sense for their living costs—at least until they start changing significantly.
Here I think we—meaning both me and you, dear reader—would benefit from some introspection. We who pay attention to economic details are not normal. Most people don’t know what “CPI” stands for, nor do they know who the Fed chair is or why it matters what the Fed does to their money. They naturally have other things on their minds.
This matters because the average consumer doesn’t look at benchmarks. They perceive inflation when it starts having visibly large and/or frequent effects on their lives. This is why food and gasoline prices matter so much; people buy them regularly enough to notice higher prices. Their contribution to inflation perceptions is greater than their weighting in the benchmarks.
The benchmarks can thus say one thing while the average person’s perception says something quite different. For example, Fed policymakers currently think inflation, while still present, is much improved. They are looking at inflation’s growth rate, which (using CPI) has indeed fallen from 9% in June 2022 to a still-high 3.2% now.
Like what you’re reading?
Get this free newsletter in your inbox every Saturday! Read our privacy policy here.
The average person, however, notices their grocery bill is quite a bit higher than it was two years ago. The fact it’s rising somewhat slower than it was is little comfort. There are hundreds if not more of mostly young ladies on TikTok complaining about not being able to survive on their income. Rather than smiling (as Boomers sometimes do to “younger” generations), pay attention to what they are complaining about: food, rent, energy, transportation. Having grown up in the 1970s when there was even worse inflation, for a decade, I can actually sympathize with them.
Listen to the quarterly calls from the largest of our companies. They ALL cite prices and inflation. From the top of the world on down, inflation is not your friend.
What most people want is for prices to not just stop rising, but go back down. It is highly unlikely the Fed can produce that. It would mean outright deflation, which wouldn’t be easy to achieve and would create other problems. As would the lesser step of igniting a recession.
All this says it is basically impossible for the Fed to “control inflation” in a way that would please most of the population. The choices are all varying degrees of bad. That being the case, tying policy to a semi-objective benchmark, however flawed it may be, is probably the best they can do.
But it’s not necessarily great.
The Case for Cuts
A great guessing game is now underway about the Fed’s next move. On one end you have those like Jim Bianco and Torsten Slok who expect no rate cuts this year. This camp argues the economy is strong or at least not slowing, making rate cuts unnecessary and possibly harmful. Loosening now might stimulate too much growth and revive inflation.
That’s a sensible view to which I’m open-minded (as I explained in my recent Higher for Longer? letter), but there are other possibilities. This week I had an enlightening video call with my friend Barry Habib of MBS Highway. He believes the Fed will cut this year, likely several times, and showed why with some of his famous charts. I’ll share these with Barry’s permission.
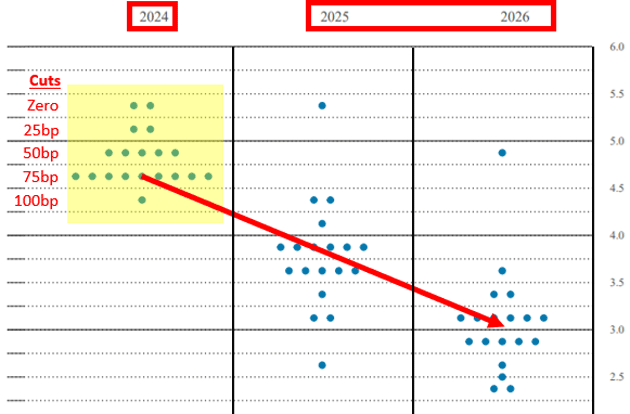
First, here is a better view of the latest “dot plots,” showing the FOMC members’ current federal funds rate projection. Each dot represents one member’s rate expectation for the end of 2024, 2025, and 2026.
Source: MBS Highway
The fed funds rate is currently in the 5.25‒5.5% range. You can see two dots there, indicating two members expect rates to end 2024 the same place they are now. (No one expects a rate hike. Remember that for future reference.)
The two other dots right below mean two members expect a 25 bp cut, and so on. Most of the dots indicate cuts will total 75 basis points from here. (People describe this as “three cuts,” presuming it will be three separate 25 point reductions, but the FOMC can choose whatever schedule it wishes).
Note that 9 members expect two rates cuts or less and 9 expect 3. Yet the market chooses to believe that the 9 who expect three cuts (plus someone who projects four rate cuts) are right. It is acceptable to ask why. I think the answer might be in the “hope and wish” category but who knows.
The red line indicates their expected progress in the next two years. By 2026 most of the dots are in the 3% area. That would be far lower than now but much more than the ZIRP era. But the fact most members think it’s feasible means they think inflation will allow it.
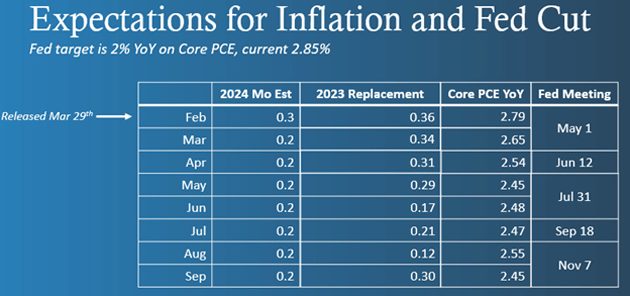
The Fed’s inflation target is to reach a 2% annual rate on the Core PCE Index. Barry made this chart to show how it will develop over the next few months as 2023 readings drop off and are replaced by more recent months.
Source: MBS Highway
The first row reflects this week’s release, which showed Core PCE rose 0.3% in February and 2.8% in the last 12 months. The rest of the chart shows what Core PCE will look like assuming (optimistically) each successive month brings a 0.2% reading. By September the Core PCE rate will have dropped to 2.45%. That’s significant but still well above target.
But more to the point, as of the June 12 Fed meeting, Barry’s projection shows Core PCE would be near 2.5% under those assumptions. That is what the “data dependent” members will have to work with.
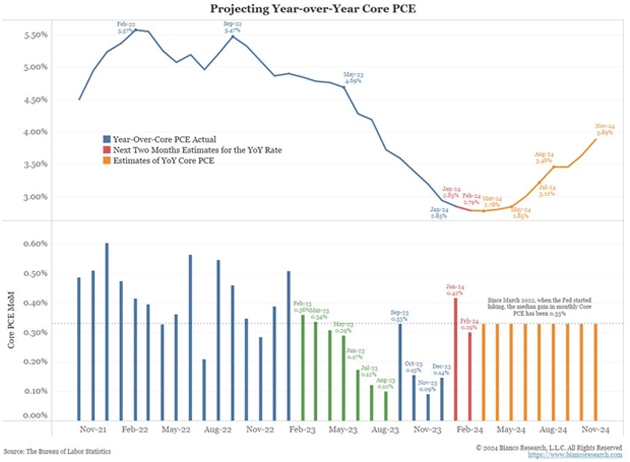
But there are others who think Core PCE will be higher. My good friend and fishing buddy Jim Bianco thinks there will be no cuts. He does the same thing Barry does (projecting future monthly PCE replacement numbers) but assuming a 0.33% monthly rate, which is more in line with recent experience. Quoting from Jim’s recent X thread:
“This next chart shows Core PCE... Year-over-year as the line and month-over-month are the bars. Blue is actual through December. Red is January (which is subject to revision and expected to be slightly higher) and February. Orange is a projection for the next several months, assuming the upcoming month’s average is 0.33%, its two-year average (orange bars).
“If the assumption of 0.33% monthly Core PCE is accurate… then Core PCE should be around 2.8% and move well above 3%. Why? See the green bars in the bottom panel. These are the monthly measures to be dropped from the year-over-year calculation (known as the base effect). They are falling, and the ‘hurdle’ to keeping Core PCE ‘sticky’ at 3+% this year is getting easier to jump over. If so, this should end the discussions of rate cuts.”
Source: Jim Bianco
Like what you’re reading?
Get this free newsletter in your inbox every Saturday! Read our privacy policy here.
I see many hands being raised. Indeed, if you took the average for only the last year it would be lower than 3.3%. But not by much and still well above 2%. The rest of this year is anyone's guess.
|
Four and Four
The Fed’s mandate is more than inflation. It is also supposed to promote maximum employment. Barry thinks that will get more important by June.
To review, here is the monthly unemployment rate since 1948. I’ve drawn a dashed line at the current 3.9% level. You can see it has rarely been lower than now. The few instances when it dropped near or below 3.9% were all just ahead of recessions (the gray shaded periods).
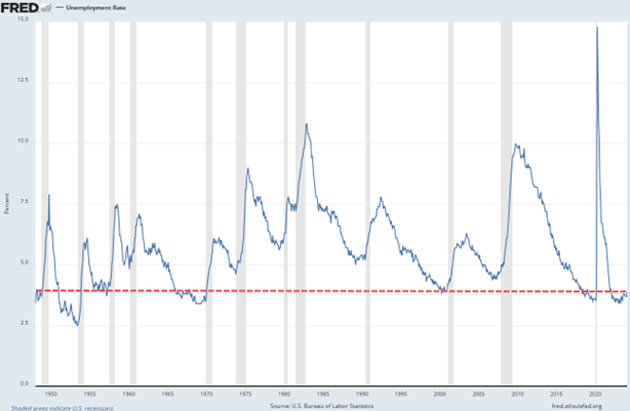
Source: FRED
You can argue from demographics that maybe this time is different. But history does suggest that when unemployment turns higher following these low points, recession is not far away. The most recent low was 3.4% in April 2023. The unemployment rate has since climbed a half-point higher. That should be a warning sign for the FOMC members.
Could the “lagging effects” of the Fed’s tightening raise unemployment and even bring the economy close to recession? Maybe. According to their March projections, all the FOMC members think unemployment has bottomed out. Most (13 out of 19) expect it to end this year at 4% or higher.
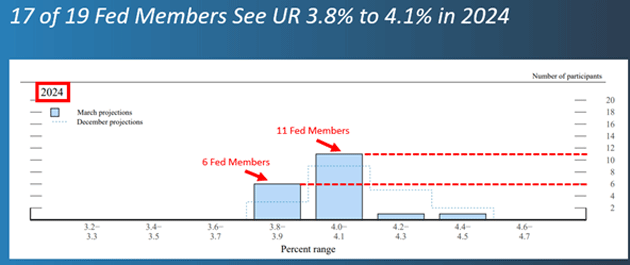
Source: MBS Highway
Of course, 4% unemployment is still historically good. I can remember writing on several occasions when it was considered full employment. The jobless rate has stayed in this range for extended periods before, but they are rare. Headline unemployment was 4% or below for four straight years from January 1966 through January 1970. The next decade wasn’t great, to say the least. But that was because the Fed let inflation get out of control. I still think Jerome Powell doesn’t want to become Arthur Burns (the 1970s Fed chair when inflation ran wild).
We saw as recently as 2020 how quickly unemployment can go through the roof. In that case it was a bolt from the blue, but even a garden-variety recession would kill many jobs. Barry Habib expects unemployment to keep rising, enough to make the FOMC start loosening even if inflation is trending above their target. And that could lead to an even worse situation: inflation and recession at the same time. Or, as we used to call it, stagflation.
Consider housing. Barry is one of the top experts and he foresees little relief. Lower mortgage rates won’t help much because we simply aren’t building enough housing to meet demand. It’s not just growing demand; it’s changing demand as people seek different kinds of homes in different areas of the country. The Fed can’t fix that, nor can anyone else in the short term.
This is not fully visible in the inflation benchmarks, which don’t reflect home prices. Peter Boockvar explained it succinctly in one of his recent notes.
“Since February 2020, right before the Federal Reserve went all in with QE and zero rates, the S&P CoreLogic home price index is up 46%. Owners’ Equivalent Rent (OER) is up ‘just’ 22%. And the bulk of that home price rise happened before the Fed started hiking rates and was clearly in response to the buying of MBS and zero rates. In other words, inflation would have been well into the double digits if home prices were the measure and the Fed was the cause of it.
“Those in Congress who think the housing market needs lower rates to ease affordability constraints don’t realize the main cause of the unaffordable challenges in housing over the past 20 years was easy money and that any savings on the mortgage rate side will be completely offset by even higher home prices. The housing market needs to work through all the low-cost mortgages and Baby Boomers need to downsize in order to create more housing supply. That’s the cure but will take years to play out.”
All real estate is local, they say, so some places may see improvement. Most won’t, which is likely to keep inflation higher than the Fed wants. Targeting OER instead of home prices in the mid-aughts helped spark the housing bubble. Will they make the same mistake again?
Food prices won’t necessarily cooperate. This chart from Tavi Costa shows how agricultural commodity prices are rising and CPI often follows.
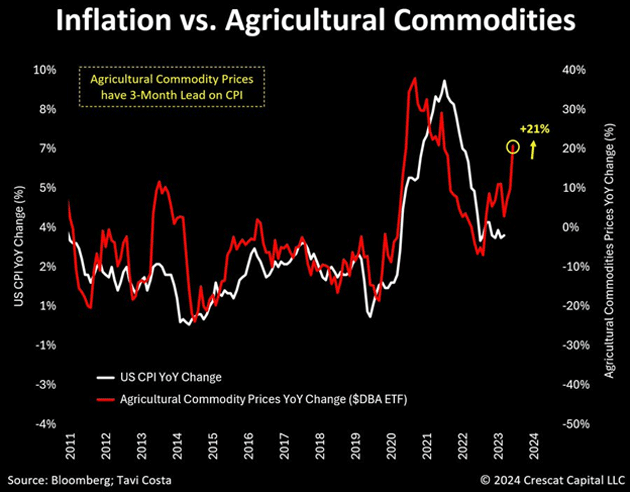
Source: Tavi Costa
Now add on top of this a potential energy shock. OPEC is cutting output quotas, facilities in Russia seem to be exploding a lot lately, the Red Sea is becoming a war zone, and we have the new data center demand I described last week. None of that is good for inflation. The Key Bridge collapse in Baltimore doesn’t help.
Already it’s looking like we may get another gasoline spike. AAA is projecting $4 national average gasoline prices this summer. That will be the highest since 2022, if it happens.
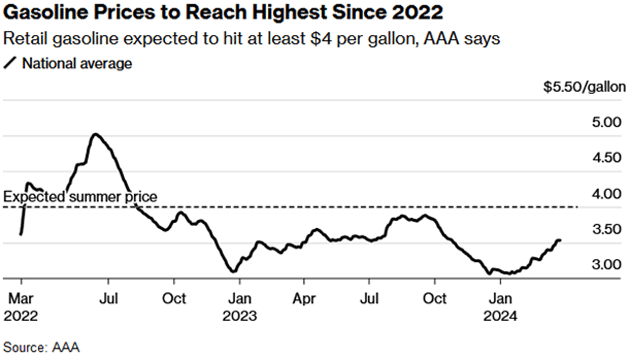
Source: Bloomberg
What happens if we get to June and the FOMC sees 4.2+% unemployment and $4 gasoline? Talk about a quandary. One of their mandates will suggest cutting right now, the other will say don’t you dare. Which is more important? Inflation running hot and potentially higher or unemployment at what would in most times be considered a good number? Is 4.2% unemployment reason enough to cut rates and risk more inflation?
The latest data shows solid GDP growth, inflation as expected, and good consumer spending. What is going to fall out of bed in the next few months to justify a rate cut? Hmmmm…
I don’t know how the FOMC members will resolve that. Like I said, I don’t envy them. But they’ll have to do something.
DC and Writing Dilemmas
Like what you’re reading?
Get this free newsletter in your inbox every Saturday! Read our privacy policy here.
I still plan on being in DC the weekend of April 13, “God willing and the creek don’t rise,” (as my dad would say). Other trips are being discussed. I must confess I enjoy living in paradise and not traveling 250,000 miles a year. I am home alone for the weekend as Shane is on a personal exploratory girl’s trip.
We did some analysis years ago which showed most readers wanting “shorter” letters. I was beginning to average 6,000+ words and more on occasion. I was given a mandate to cut to around 3,000 words. Today could have easily been over 6,000 words. So much is important on this topic. What to include and what to cut?
In the spirit of shorter is better, let me hit the send button and wish you a happy Easter. I remember coloring eggs with my kids so many years ago. I do need to travel more to see my grandkids. Or get them to come here. Have a great week and don’t forget to follow me on X!
|
Your thinking higher for longer analyst,

John Mauldin
P.S. If you like my letters, you'll love reading Over My Shoulder with serious economic analysis from my global network, at a surprisingly affordable price. Click here to learn more.
Tags
Suggested Reading...
|
|
Did someone forward this article to you?
Click here to get Thoughts from the Frontline in your inbox every Saturday.
