Are Valuations Really Too High?
-
 John Mauldin
- |
- May 10, 2014
- |
- Comments
- |
- View PDF
Take It to the Limit
In a Perfect World
The Future of Earnings
How Did We Get Here?
It’s Not Only Stock Market Valuations
San Diego, Italy, and Nantucket
The older I get and the more I research and study, the more convinced I become that one of the more important traits of a good investor or businessman is not simply to come up with the right answer but to be able to ask the right question. The questions we ask often reveal the biases in our thinking, and we are all prone to what behavioral psychologists call confirmation bias: we tend to look for (and thus to see, and to ask about) things that confirm our current thinking.
I try to spend a significant part of my time researching and thinking about things that will tell me why my current belief system is wrong, testing my opinions against the ideas of others, some of whom are genuine outliers.
I have done quite a number of media interviews and question-and-answer sessions with audiences in the past few months, and one question keeps coming up: “Are valuations too high?” In this week’s letter we’re going to try to look at the various answers (orthodox and not) one could come up with to answer that basic question, and then we’ll look at market conditions in general. This letter may print a little longer as there are going to be a lot of charts.
I am back in Dallas today, getting ready to leave Monday for San Diego and my Strategic Investment Conference. I’m really excited about the array of speakers we have this year. We’re going to share the conference with you in a different way this year. My associate Worth Wray and I are going to do a brief summary of the speakers’ presentations every day and send that out as a short Thoughts from the Frontline for four days running. Plus, for those who are interested in my more immediate reactions, I suggest you follow me on Twitter. There are still a few spots available at the conference, as we have expanded the venue, and if you would like to see who is speaking or maybe decide to show up at the last minute (which you should), just follow this link. Now let’s jump into the letter.
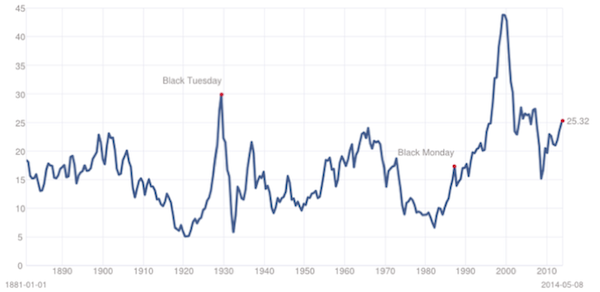
First, let’s examine three ways to look at stock market valuations for the S&P 500. The first is the Shiller P/E ratio, which is a ten-year smoothed curve that in theory takes away some of the volatility caused by recessions. If this metric is your standard, I think you would conclude that stocks are expensive and getting close to the danger zone, if not already in it. Only by the standards of the 2000 tech bubble and the year 1929 do you find higher normalized P/E ratios.
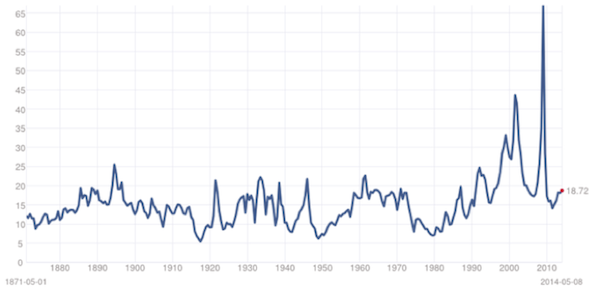
But if you look at the 12-month trailing P/E ratio, you could easily conclude that stocks are moderately expensive but not yet in bubble territory.
And yet again, if you look at the 12-month forward P/E ratio, it might be easy to conclude that stocks are fairly, even cheaply priced.
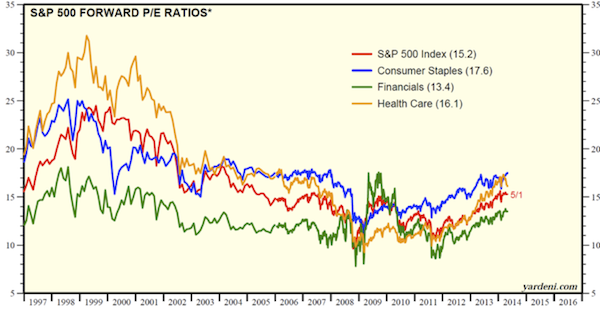
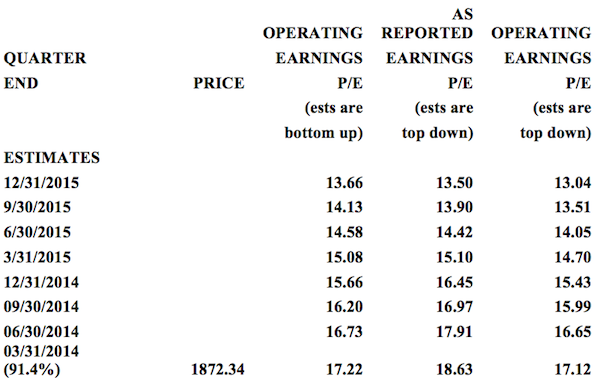
Earnings are projected to grow rather significantly. Let’s visit our old friend the S&P 500 Earnings and Estimate Report, produced by Howard Silverblatt (it’s a treasure trove of data, and it opens in Excel here.
I copied and pasted below just the material relevant for our purposes. Basically, you can see that using the consensus estimate for as-reported earnings would result in a relatively low price-to-earnings ratio of 13.5 at today’s S&P 500 price. If you think valuations will be higher than 13.5 at the end of 2015, then you probably want to be a buyer of stocks. (Again, you data junkies can see far more data in the full report.)
But this interpretation begs a question: How much of 2013 equity returns were due to actual earnings growth and how much were due to people’s being willing to pay more for a dollar’s worth of earnings? Good question. It turns out that the bulk of market growth in 2013 came from multiple expansion in the US, Europe, and United Kingdom. Apparently, we think (at least those who are investing in the stock market think) that the good times are going to continue to roll.
Like what you're reading?
Get this free newsletter in your inbox every Saturday! Read our privacy policy here.
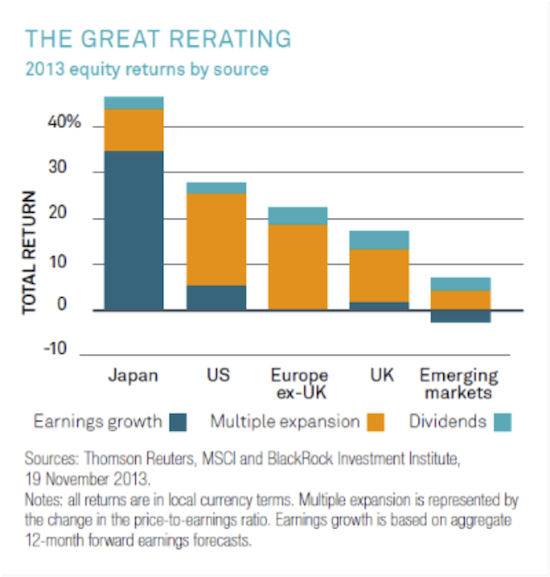
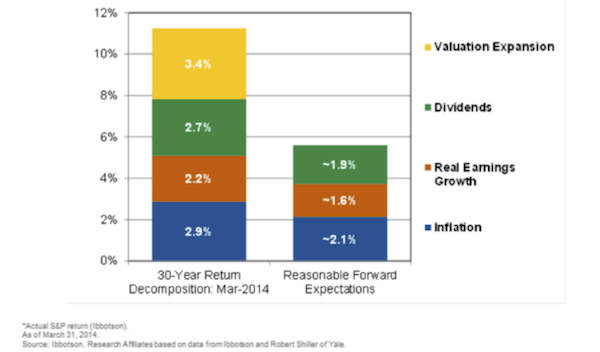
The chart above shows the breakdown of 2013 return drivers in global markets, but this next chart, from my friend Rob Arnott, shows that roughly 30% of large-cap US equity (S&P 500) returns over the last 30 years have come from multiple expansion; and recently, rising P/E has accounted for the vast majority of stock returns in the face of flat earnings.
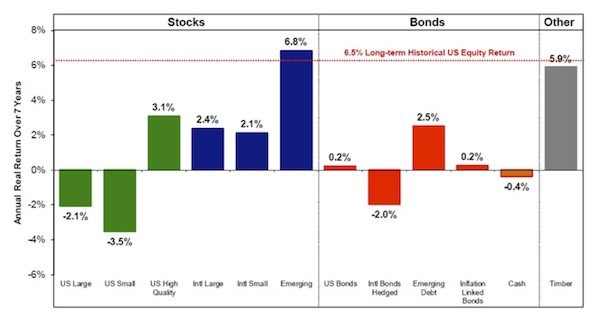
What kind of returns can we expect from today’s valuations? There are two ways we can look at it. One way is by looking at expected returns from current valuations, which is how Jeremy Grantham of GMO regularly does it. The following chart shows his projections for the average annual real return over the next seven years.
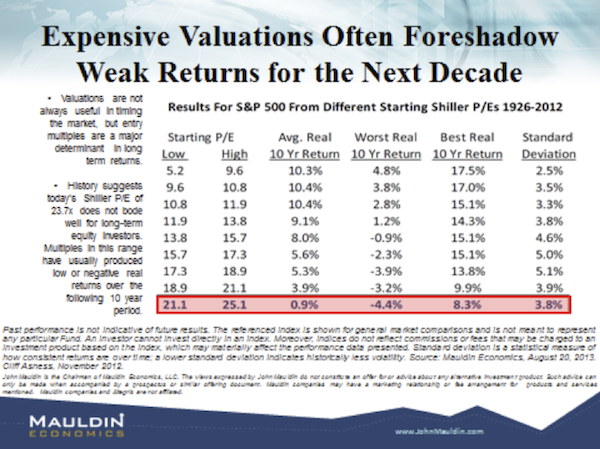
If you go back to the very first chart we looked at, which showed the Shiller P/E ratio for the S&P 500, you can see that it is quite high. If you break returns down to 10-year periods for the last 86 years and rank those returns from the highest to the lowest in 10 groups, you find out that, reasonably enough, if you start out at a low price-to-earnings ratio, your returns for the next 10 years are likely to be quite high. If you start from where we are today, though, the same methodology suggests that your returns might be anywhere from -4.4% to +8.3%, or less than 1% on average, not exactly a projection likely to warm an investor’s heart.
I was talking with my good friend Ed Easterling of Crestmont Research, as I often do when I’m thinking about stock market valuations – he’s one of the most thoughtful analysts I know. We were looking at some charts on his always-useful Crestmont Research website, and he offered to modify one of the reports for this letter. You can see the updated version at Crestmont P/E Report. Here’s what he wrote to accompany the table below:
The outlook may be uncertain, but that does not make it unpredictable. The current secular bear could remain in hibernation. The inflation rate could remain low and stable, thereby sustaining P/E in the range of 20 to 25. The current secular bear could succumb to a period of higher inflation or deflation, thereby P/E declines to levels associated with the end of typical secular bears (at or below 10). Alternatively, P/E might begin to migrate along its secular bear course, only to arrive near its historical average around 15. The outlook may be uncertain, yet we can assess the range of potential outcomes using these three scenarios.
Consistent with a foggy crystal ball, the horizon is likewise variable. Some people may want to see the impact of a fast path (say, 5 years), while others may take a somewhat longer view of a decade or more.
The result is a forecast providing a matrix of outlooks based upon your assumptions. Pick your time, pick your ending P/E, and add in dividend yield for the expected total return from the stock market. Figure 7 shows that secular bear markets are periods of below-average returns. The magnitude of the annualized return (or loss) depends upon the investor’s time period. Most notably, however, is that none of the scenarios provide average or above-average returns. As history has shown, average or above-average returns cannot occur from levels of relatively high valuation without the multiple expansion of a rising P/E. From today’s lofty levels, bubble conditions would be required… and that’s not a reasonable assumption for any investor’s portfolio.
Figure 7. Crestmont Research Outlook (S&P 500 Total Return)
|
AS OF: MAR 31, 2014 |
TOTAL ANNUALIZED RETURN FOR S&P 500 |
|||
|
|
(nominal returns) |
|||
|
|
|
|
||
|
|
|
P/E Ratio (P/E10) |
||
|
|
YEARS |
10 |
15 |
22.5 |
|
|
5 |
-10.4% |
-3.0% |
5.0% |
|
|
7 |
-5.8% |
-0.3% |
5.5% |
Like what you're reading?Get this free newsletter in your inbox every Saturday! Read our privacy policy here.
|
10 |
-2.2% |
1.8% |
5.9% |
|
|
20 |
2.3% |
4.3% |
6.4% |
|
|
|
|
||
|
|
Notes 1-5: see footnotes in Figure 1; also, includes dividend yield of 2% |
|||
|
|
Copyright 2008-2014, Crestmont Research (www.CrestmontResearch.com) |
|||
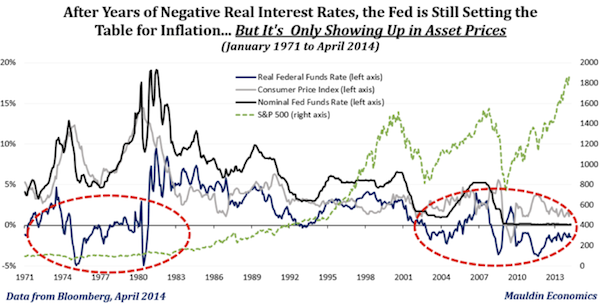
I think we have to admit that quantitative easing on the scale that it has been practiced by the Federal Reserve for the past few years has had a great deal to do with the rise in the prices of stocks. We’re not seeing the massive inflation that was predicted with the swelling of the money supply, except in asset prices, as the chart below shows.
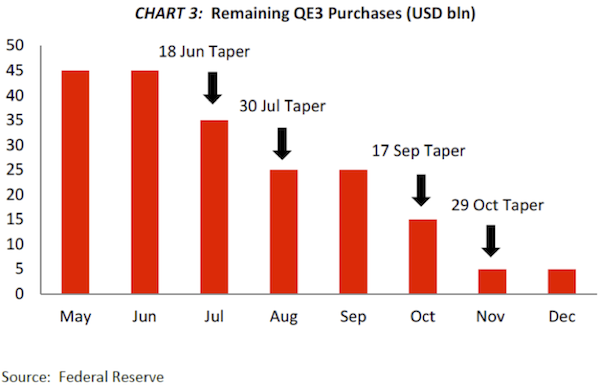
The tapering by the Fed is well underway and will be completed sometime this fall. It would not surprise me if they come to October and just go ahead and take off the final $5 billion along with the expected $10 billion reduction. It would seem pretty pointless to maintain just a $5 billion QE program. (Thanks to Josh Ayers at Paradarch Advisors for the following chart.)
It’s Not Only Stock Market Valuations
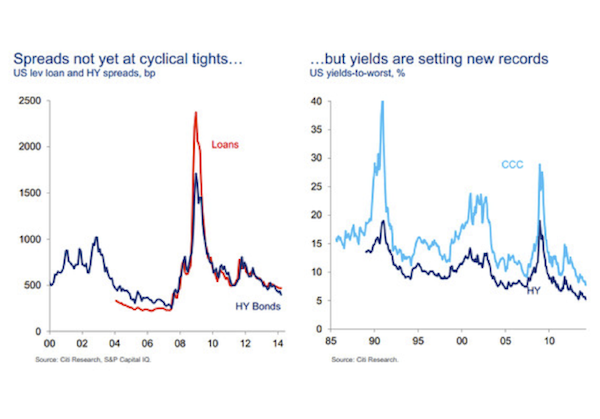
Bonds are beginning to get a little stretched as well. This note from MarketWatch pretty much tells the story:
If it’s not happening immediately, when will it happen? Valuations are getting pretty high, prompting junk bond guru Martin Fridson to say the asset class is in a state of “extreme overvaluation.” Credit is in such high demand right now that it’s prompting big name investors like DoubleLine Capital’s Jeffrey Gundlach to declare that the asset class is too crowded.
Citi credit strategist Matt King, who is out with an extensive report this week about the current state of the credit market, has this chart to show:
Like what you're reading?
Get this free newsletter in your inbox every Saturday! Read our privacy policy here.
It will be interesting to see what Jeff Gundlach says at our Strategic Investment Conference this week. As well as David Rosenberg, Lacy Hunt, Gary Shilling, and others who will always opine on the bond market. As I mentioned at the beginning, we will be sending you updates from the conference, and you really should follow me on Twitter.
San Diego, Italy, and Nantucket
I leave Monday morning for San Diego to prepare for the conference (co-sponsored with Altegris) and to spend a day with my partners planning and shooting videos. I have really been anticipating this conference, not only because of the speakers but because this is the place where I catch up with so many friends and meet new ones. This really is just about my favorite week of the year. While we may have trouble finding value in the stock market, I always find that time with my friends is about the most valuable time I can spend. Right now, my daughter Tiffani is scheduled to come, as well as most of my staff. Tiffani has not been to the last few conferences, and she is looking forward to catching up as well.
I’ve been working on my presentation for about eight weeks now. The theme for the conference is “Investing in an Age of Transformation,” and I want to try to really focus our attention on the large trends in the world, both economic and technological, that are going to have rather massive implications for our investment portfolios.
Following the conference, I’ll be home for a few weeks before I take off for a working vacation in a little town in Tuscany called Trequanda. I will also be in Rome June 14-17, where I will be joined by Christian Menegatti from Roubini Global Economics. We plan to spend time with various businessmen, investors, central bankers, and politicians to get a better understanding of what is really unfolding in Italy. We are actively looking for people to visit and especially for business associations with whom we can meet. Drop me a note if you’re interested.
Then I’m home for another month before I have a speaking engagement in Nantucket, Massachusetts, in the middle of July. And of course the first Friday of August will find me in Grand Lake Stream, Maine, where I will once again be trying to outfish my youngest son on our annual fishing trip to “Camp Kotok.”
I am often asked how I can travel so much. I admit that from time to time it can be a bit physically wearing, but I have come to the conclusion that it’s early mornings and insufficient sleep that is the main culprit in travel weariness. I find that if I get enough sleep and can find a gym, then I seem to be okay. I guess it’s just important to stay away from those early-morning meetings if you’re going to be out late the night before.
It is time to hit the send button. The gym is calling. Have a great week!
Your just trying to keep up analyst,

John Mauldin
P.S. If you like my letters, you'll love reading Over My Shoulder with serious economic analysis from my global network, at a surprisingly affordable price. Click here to learn more.
Put Mauldin Economics to work in your portfolio. Your financial journey is unique, and so are your needs. That's why we suggest the following options to suit your preferences:
-
John’s curated thoughts: John Mauldin and editor Patrick Watson share the best research notes and reports of the week, along with a summary of key takeaways. In a world awash with information, John and Patrick help you find the most important insights of the week, from our network of economists and analysts. Read by over 7,500 members. See the full details here.
-
Income investing: Grow your income portfolio with our dividend investing research service, Yield Shark. Dividend analyst Kelly Green guides readers to income investments with clear suggestions and a portfolio of steady dividend payers. Click here to learn more about Yield Shark.
-
Invest in longevity: Transformative Age delivers proven ways to extend your healthy lifespan, and helps you invest in the world’s most cutting-edge health and biotech companies. See more here.
-
Macro investing: Our flagship investment research service is led by Mauldin Economics partner Ed D’Agostino. His thematic approach to investing gives you a portfolio that will benefit from the economy’s most exciting trends—before they are well known. Go here to learn more about Macro Advantage.
Read important disclosures here.
YOUR USE OF THESE MATERIALS IS SUBJECT TO THE TERMS OF THESE DISCLOSURES.
Tags
Did someone forward this article to you?
Click here to get Thoughts from the Frontline in your inbox every Saturday.

 John Mauldin
