Connecting the Dots:Distressed American Workers Expose the Fallacy of Improving Unemployment Numbers
- Shannon Staton
- |
- August 18, 2015
- |
- Comments
“Over the past five years, our businesses have created more than 11 million new jobs. Our economy is growing and creating jobs at the fastest pace since 1999.”
—President Obama
Sure, the headline jobs numbers suggest that Obama is right and that the job situation is improving:
The Labor Department reported that initial claims for unemployment insurance fell to their lowest level in 42 years.
The Institute of Supply Management’s index of non-manufacturing employment (“Would you like some fries with that, sir?”) hit the highest level in 10 years.

The Labor Department reported that the US economy created 223,000 new jobs—the 57th month in a row of net job creation—and a drop in the unemployment rate to 5.3%, the lowest level since April 2008.
Sounds good… right? However, despite those feel-good headlines, the average American is far, far from solid financial footing. Here’s what I mean:
Job Growth but No Wage Growth. Job seekers may find it easier to find a job, but good luck trying to find a job that pays enough to support a family.
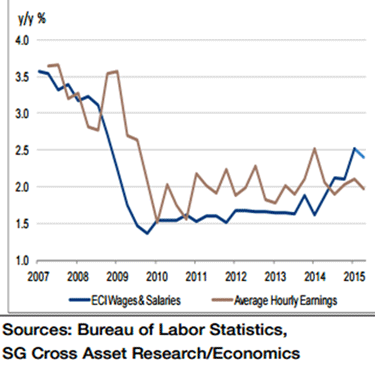
The lightly followed Department of Labor’s quarterly Employment Cost Index (ECI) is Janet Yellen’s favorite wage indicator for good reason: it most accurately reflects the true cost of labor to businesses.
Well… the ECI increased by 0.2% in the second quarter of 2015. That was not only way below what Wall Street was expecting, it was also the slowest pace of wage growth since 1982 when ECI record keeping started!
Those are bad numbers, but it is really worse if you dig below the headlines:
Devilish Detail #1: Government Worker Wages, Not Private Sector.
The overall ECI was up by 0.2%, but that is only because compensation for government workers increased by +0.6%.
What about the private sector? Change in compensation: 0%. Yup… ZILCH… NADA… ZERO… not a penny.
Devilish Detail #2: Benefits, Not Wages, Are Rising.
In the past 12 months, the ECI is up 2%. Sure, that kind of increase is nothing to shout about, but 2% is better than a sharp stick in the eye.
Hold on… not so fast!
Remember, there are two components of labor costs: (1) wages and (2) benefits like paid vacation, Social Security, workers’ compensation, and health insurance. Wages are roughly 70% of ECI, and benefits make up the remaining 30%.
Over the last 12 months, the cost of benefits has increased by +1.7%. My guess is that the lion’s share of that increase can’t be attributed to higher health insurance costs.
Moreover, the trend these days is for employers to pass on some or all of the higher costs of health insurance to employees, thus reducing take-home pay.
You know where else these measly wage gains are showing up? In homeownership.
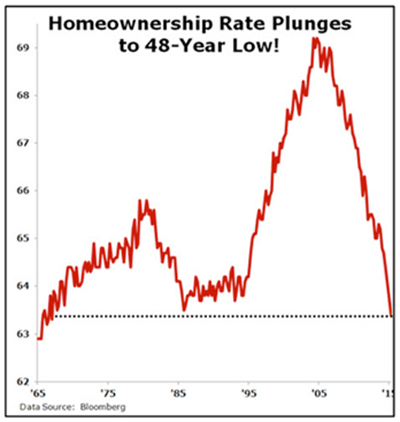
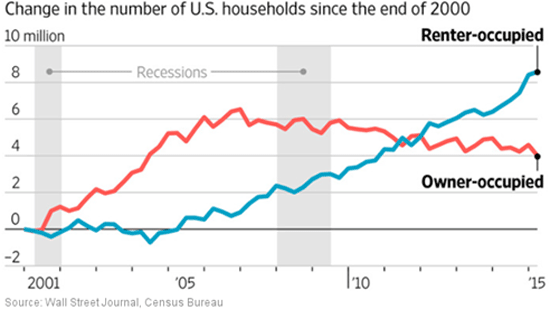
Despite record-low interest rates, an increasing number of Americans are renting rather than buying. The Census Bureau reported that the US homeownership fell to 63.4%, the lowest level in 48 years.
The homeownership rate peaked in 2004 at 69.2%, but has been falling ever since.

Moreover, the rate of homeownership hasn’t been this low since 1967, when it was 63.3%.
The “Millennial” generation—defined as 18- to 34-year-olds—are living with their parents at an alarming rate. The Census Bureau reported that more Millennials are living with their parents than ever before.
In 2007, 71% of Millennials lived on their own, but the Census Bureau found that only 67% are living on their own now!
What does all this mean to investors?
As a participant in a consumer-driven economy, you should be worried—very worried—about the long-term direction of the stock market, because consumer spending is a function of how much money you have in your wallet.
As signs of slowing consumer spending and stalling retails sales are increasing… the stock market will soon follow.
The question is: How are you going to protect your portfolio when stocks slide into a bear market?
First, start out by picking solid, dividend-paying companies with very high yield. A successful automaker we recommended in May 2014 is currently up 16.0%, plus dividends of 3.6%. A real estate investment trust we’re holding is up 18.8%, plus dividends of 4.5%. Those are only two examples from the Yield Shark portfolio... I invite you to check it out risk-free for 3 months.

Tony Sagami
30-year market expert Tony Sagami leads the Yield Shark and Rational Bear advisories at Mauldin Economics. To learn more about Yield Shark and how it helps you maximize dividend income, click here. To learn more about Rational Bear and how you can use it to benefit from falling stocks and sectors, click here.


